Grand Canyon Permit Lottery Analysis
Another year, another non-tax deductible charity donation to the federal government; aka 🎉 Permit Application Season 🎉
📝 Permit Lottery Background
For the uninitiated most multi-day river trips in the US require a permit to float them. This is due to a variety of reasons, the primary ones being
- the popularity of these natural resources, and
- the environmental impacts associated with humans in these delicate ecosystems.
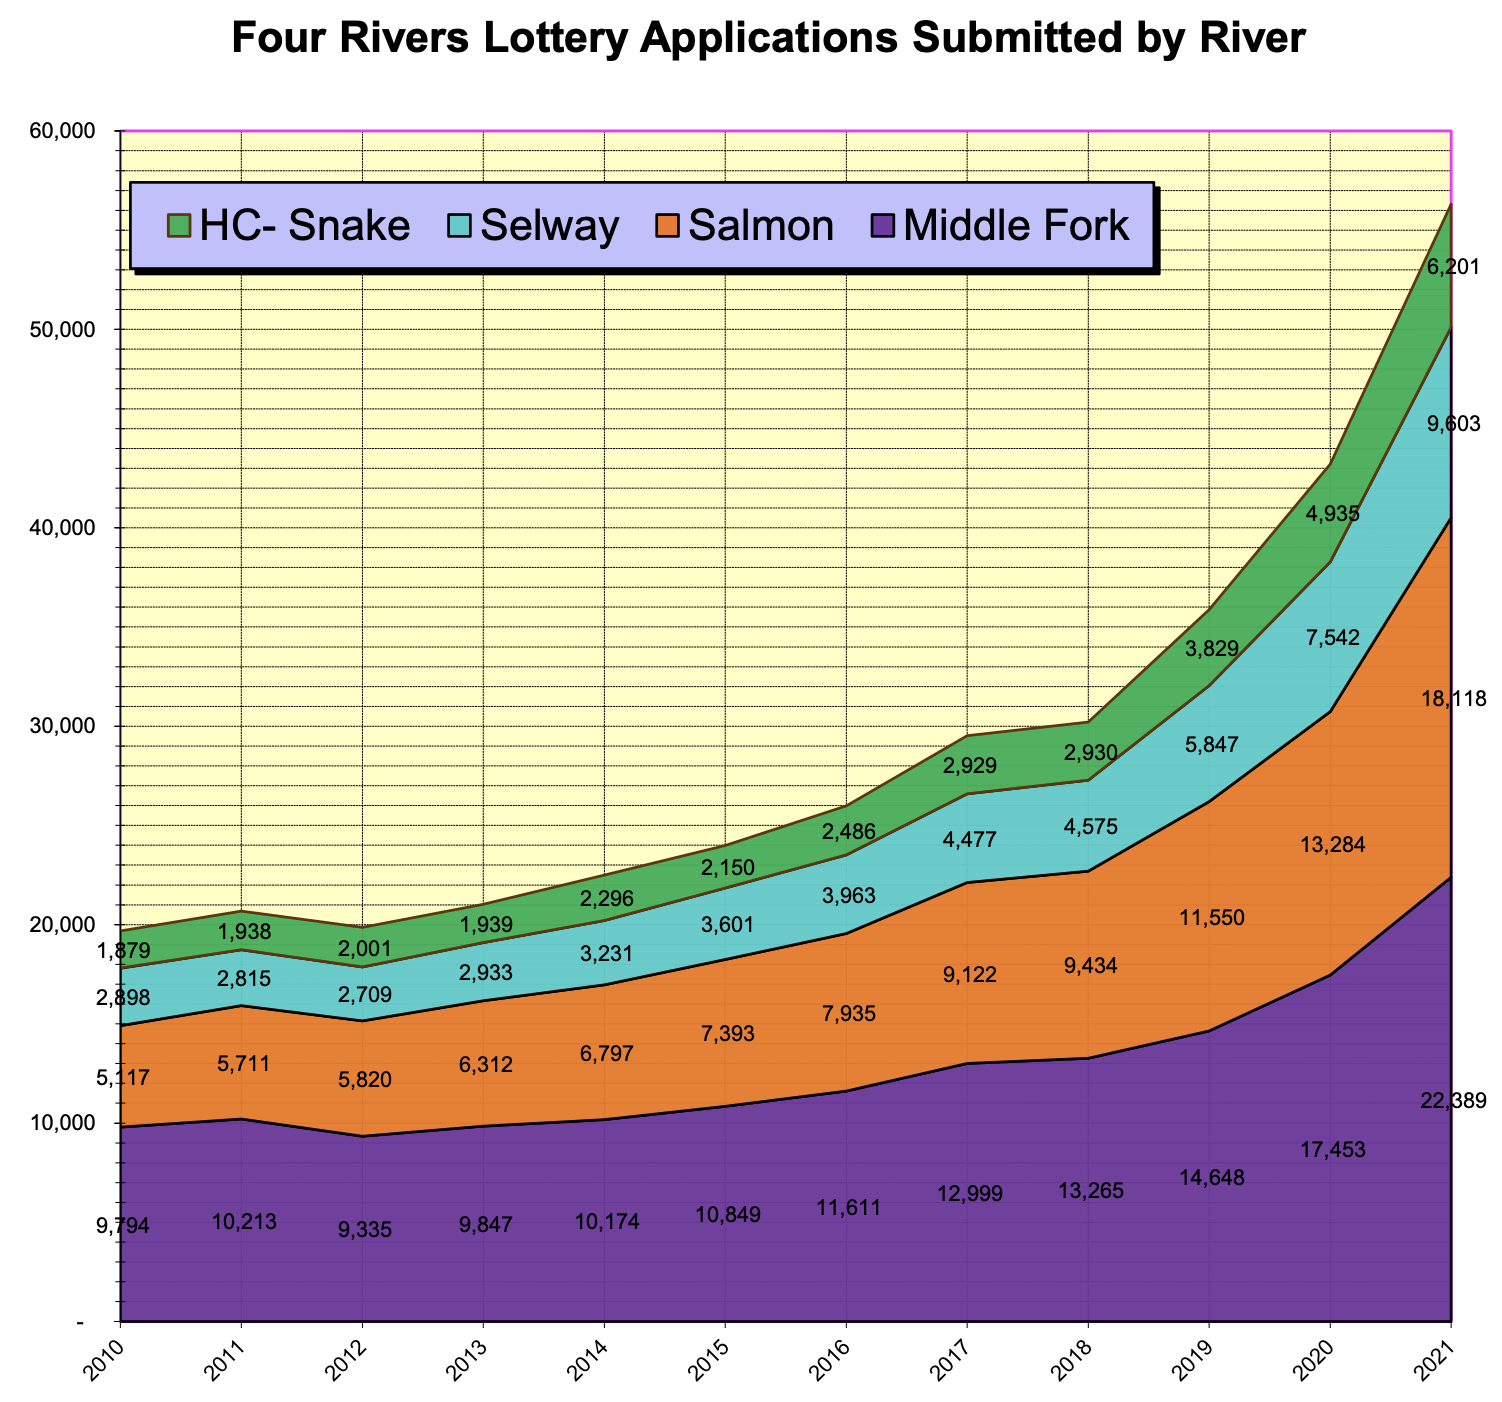
In order to reduce the human impact, the federal government has instituted a variety of permit lotteries for the different rivers. To float the river during its peak season 1, users pay a fee (on the order of ~$60/year for entry in several of the popular rivers) to enter a lottery for a chance to win a permit. Over time, the number of people applying to these permits has been steadily increasing - meaning the chance of winning is steadily decreasing:
As an avid boater, I understand the need to reduce the amount of human traffic in these environments (the solitude is a huge part of what makes them special!) but also grow more frustrated each year with how hard it is to get on the river. I built a permit scraper (https://tethys.riomcmahon.me/) to alert via slack when a cancelled permit is available which has had some limited success; but what if we could use ✨ data science ✨ to increase our odds in the actual lottery?
🤓 Analysis
Github repo can be found containing analysis notebook and PDF -> CSV parser can be found here.
The Grand Canyon lottery system actually does a pretty good publishing lottery statistics (albeit in PDF form). After parsing the PDF data into a csv format we can analyze the data for some trends - ideally actionable ones that give us insight into launch dates that maximize the probability of winning the permit.
Starting off we can confirm that GC lottery applications have been increasing year over year:
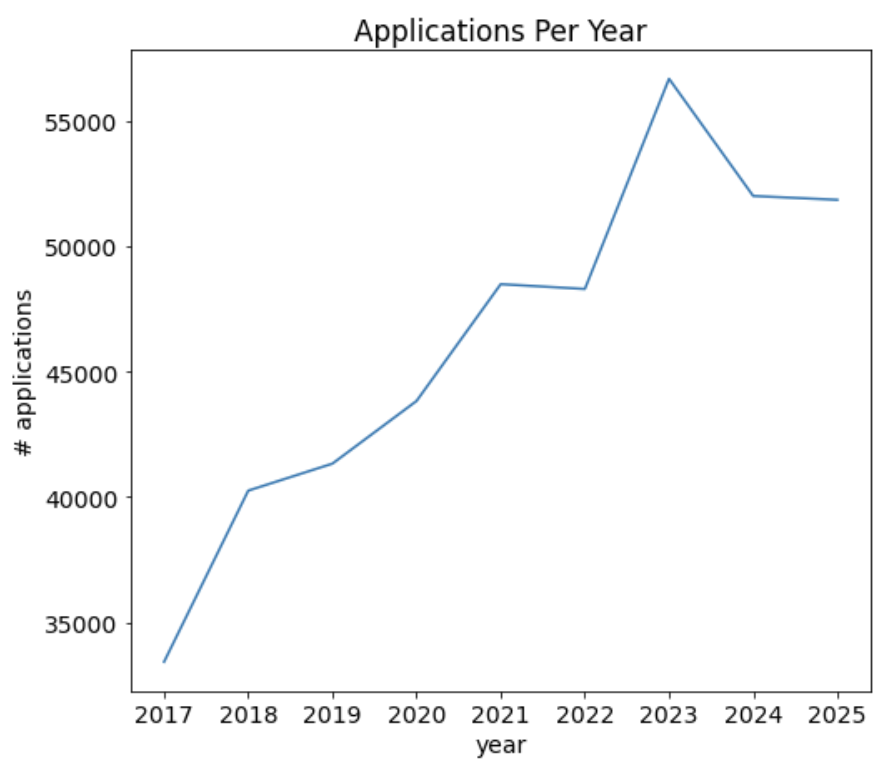
😢
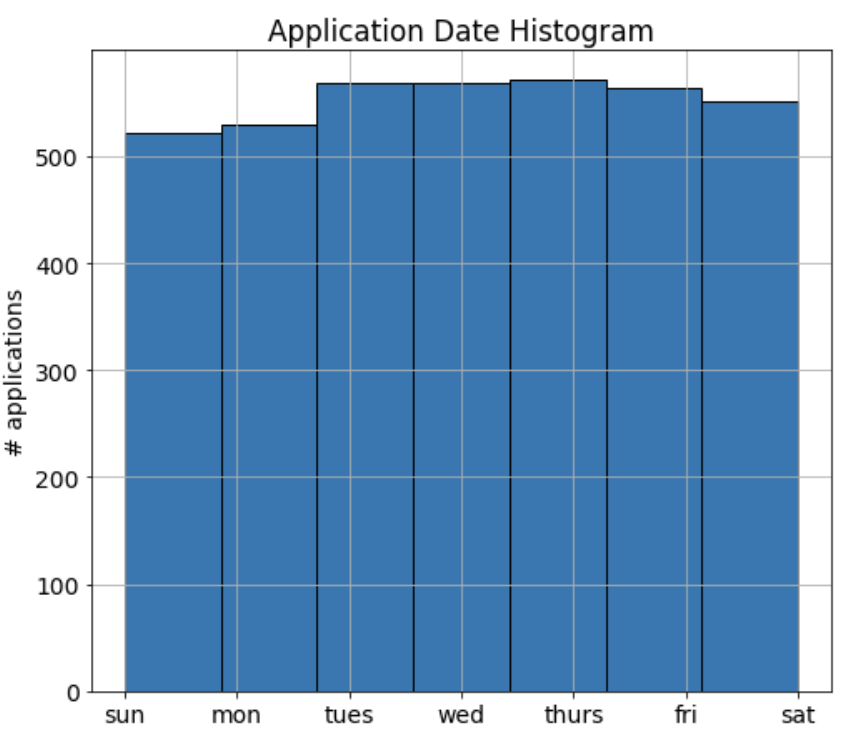
Next, we can plot the number of applications for launch date by day of the week - we can see that applying for a Sunday launch date gives us a very slight edge.
Plotting the number of permit applications based on launch date day of the year shows us a couple different things:
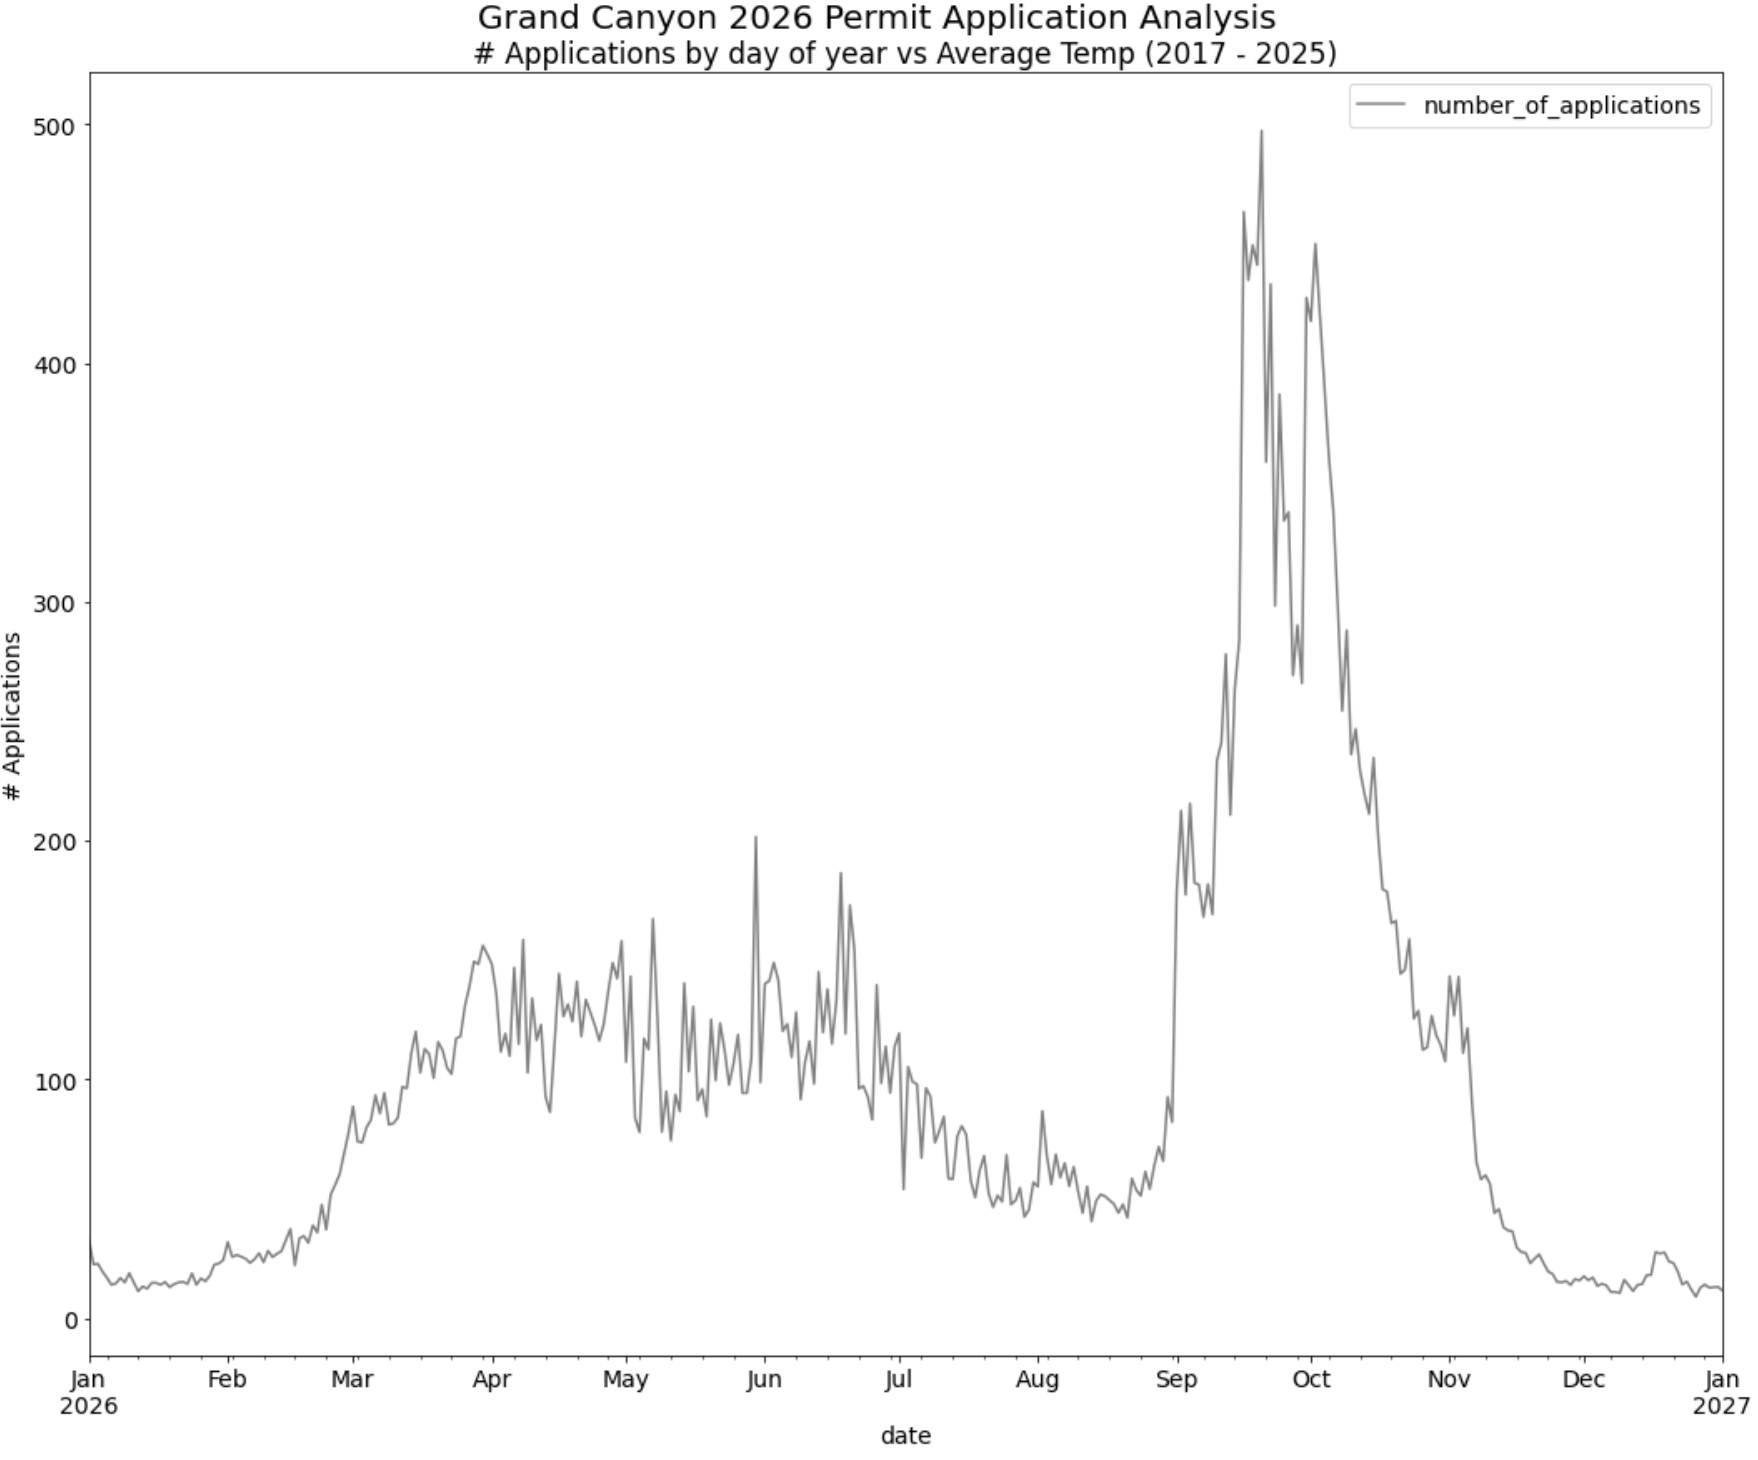
- Applications reach their peak between mid-September and late-October (this is a goldilocks zone for weather; not blisteringly hot and not too cold)
- Applications are at their low during the winter months (it gets REAL chilly down there)
- Late spring/early summer are popular with a decrease during peak summer months (it gets very hot but nothing a few
lukewarm“river cold” Modelos can’t fix)
Keeping with the weather trend, it is useful to look at the average daily temperature at “Phantom Ranch” (a small enclave at river level about halfway through the trip).
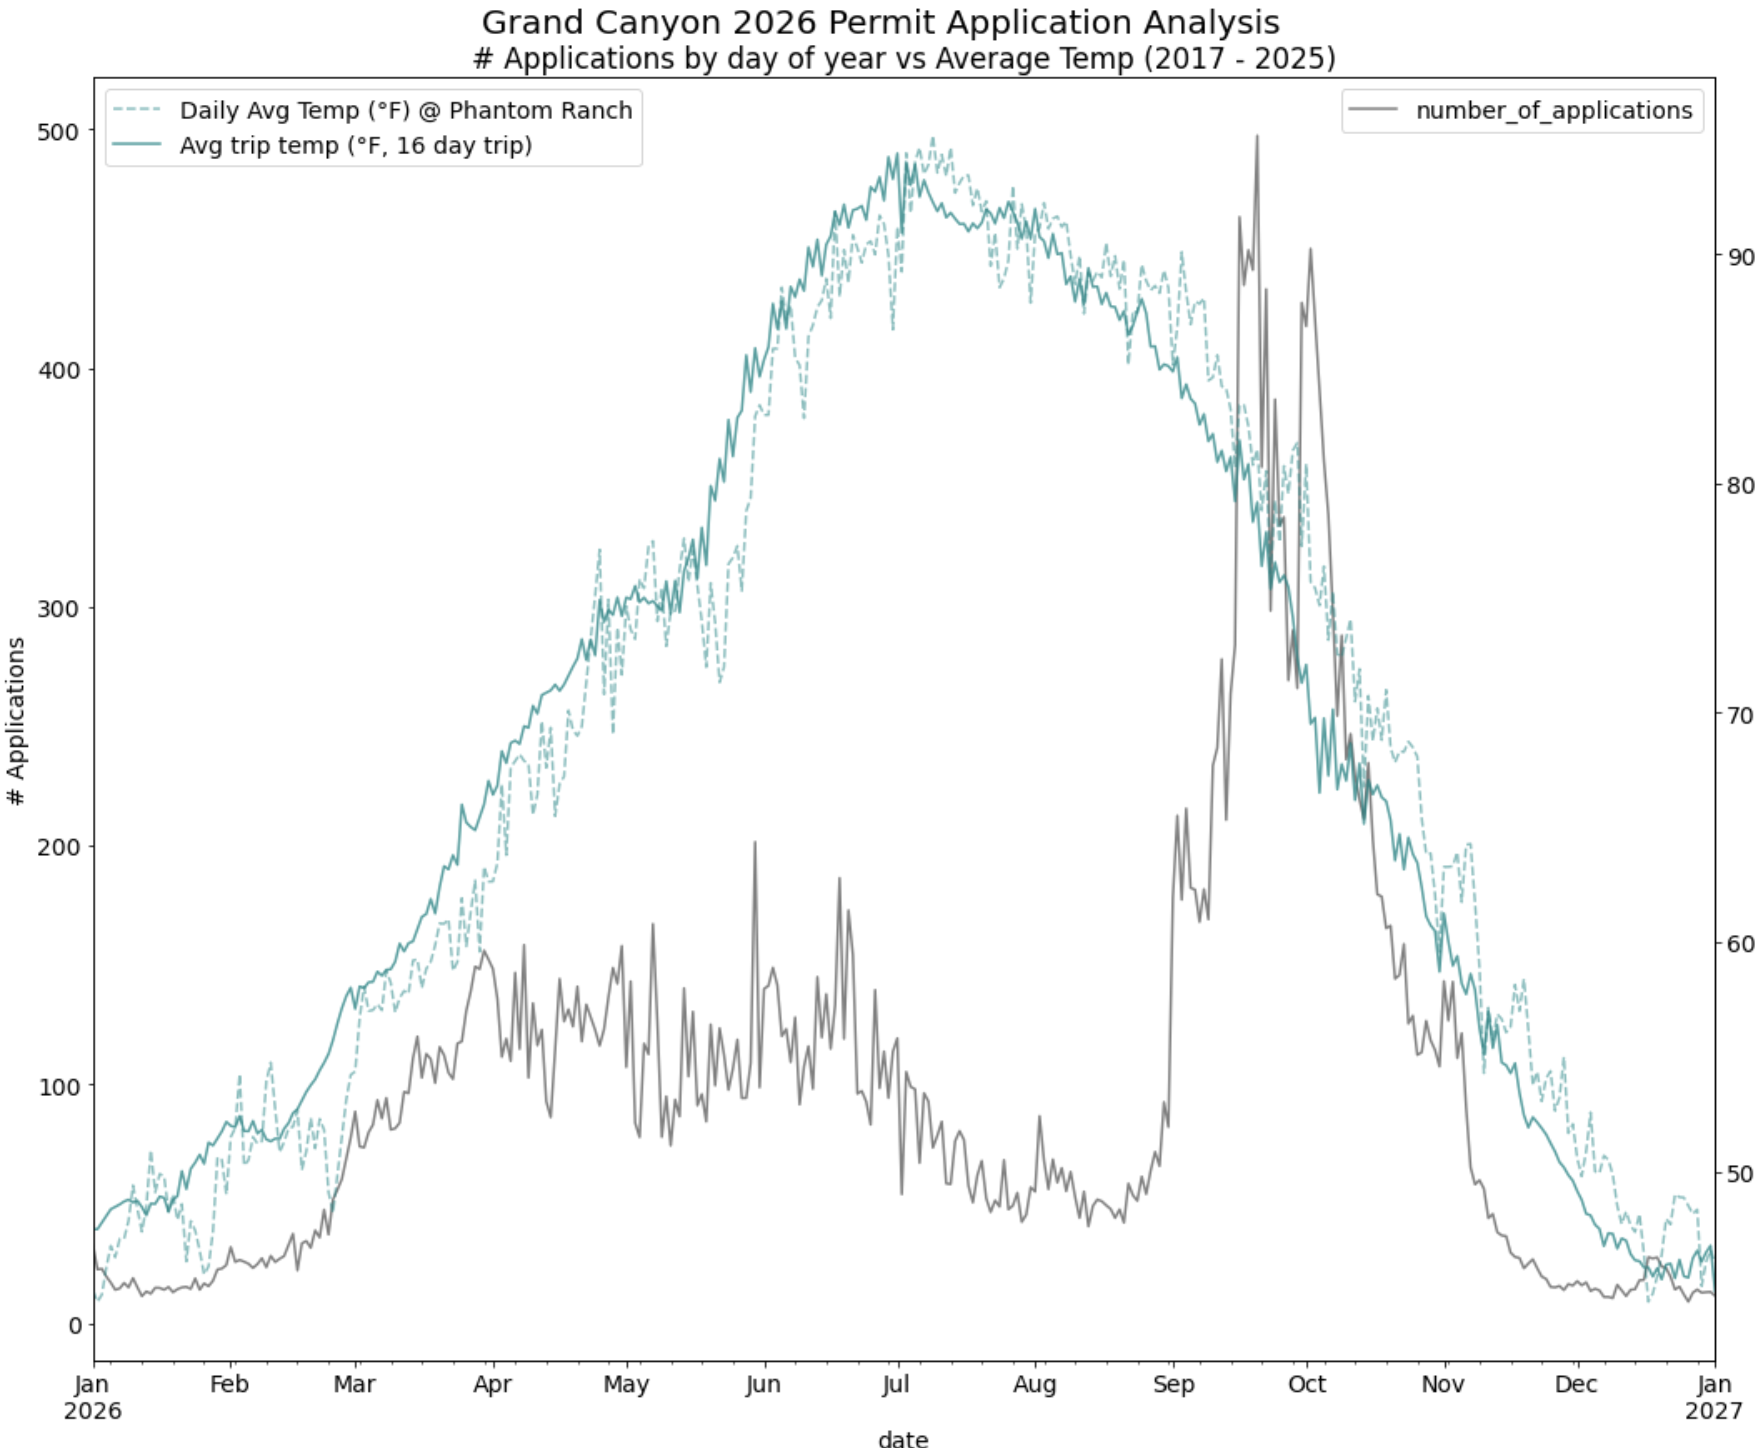
This generally tracks with the conjecture above. Note here that we also plot the 16-day look ahead average temperature; this is useful because the average trip duration is ~16 days and a trip can still be totally worth it if it starts a little cold and ends up balmy.
Finally it is useful to plot the quantiles of the number of applications per day of year:
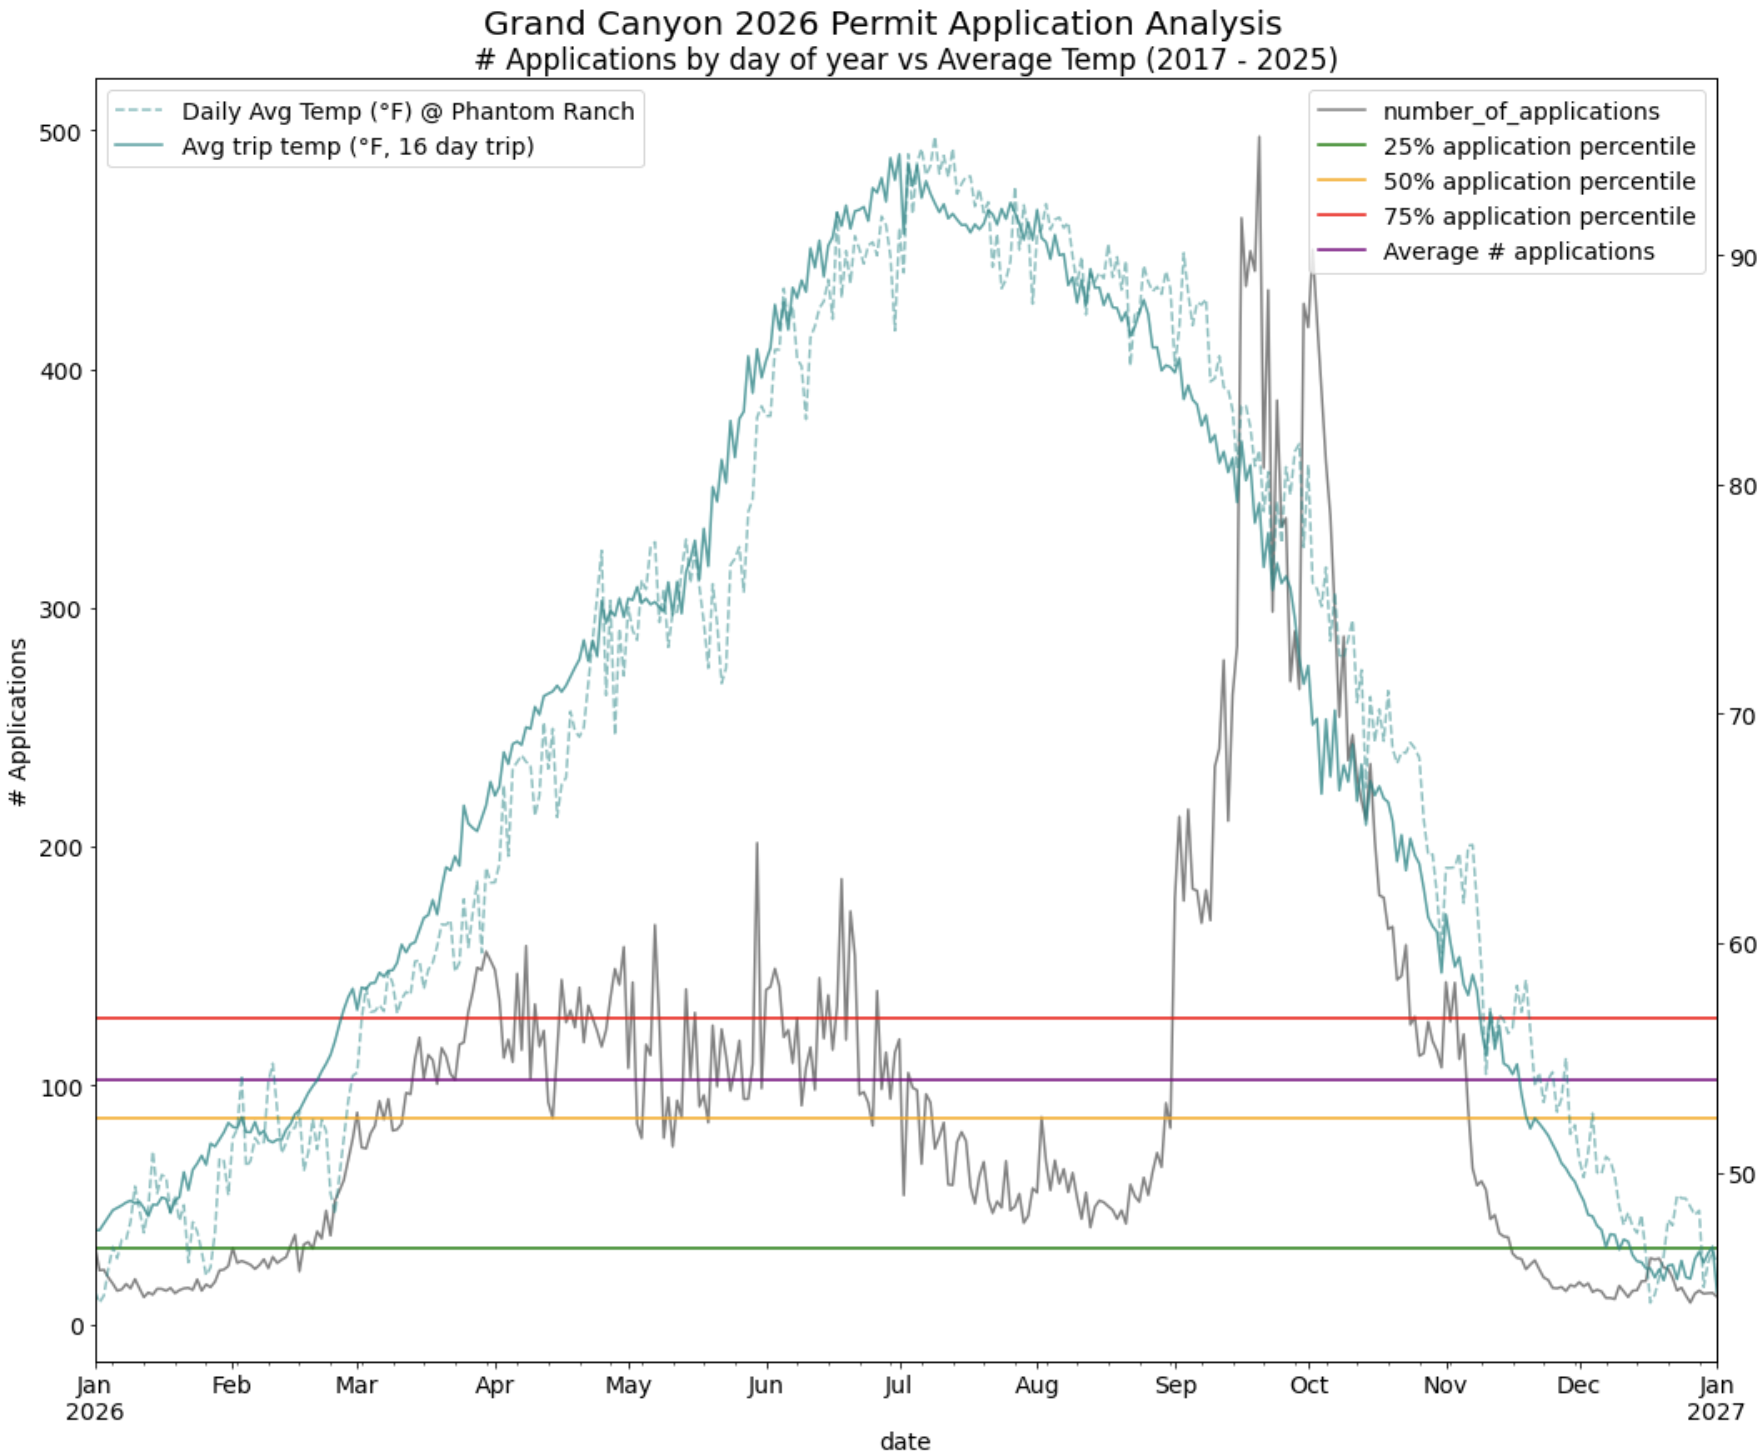
We see that dates with the number of applicants below the 25th-percentile are exclusively during the late-fall/early winter months when trip temps are quite chilly (and the days are short).
🎰 “Optimal” Dates
Now that the data is in a nice clean form we can use it to pose questions on when we should apply to give us the greatest chance of winning (but also the warmest trip!). A couple scenarios I used during the 2026 lottery:
| Condition(s) | Sorting | Application Dates |
|---|---|---|
| # applications < 25th percentile, AND launch date = Sunday | Average Trip Temp | 11/22/26, 2/1/26, 2/8/26, 1/25/26, 11/29/26 |
| # applications < 25th percentile | Average Trip Temp, # applications | 11/17/26, 11/16/26, 2/19/26, 11/18/26, 2/16/26 |
| # applications < 25th percentile, AND average trip temp > 52°F | Average Trip Temp | 11/17/26, 11/16/26, 2/19/26, 11/18/26, 2/16/26 |
I ended up using strategy #2 in the 2026 lottery; I have very low expectations that this approach will yield any discernible advantage, but hey - it feels a lot more productive than bitching on mountain buzz.
Happy boating!
- Most rivers have non-lottery permits available during off-peak times of the year. These periods generally don’t have enough water for the river to be reasonably runnable but in some cases (e.g. the Main Salmon), the pre-permit season can have very high flows that most boaters would not consider running. [return]